New Dashboard Design

New and Improved Coverage Dashboard

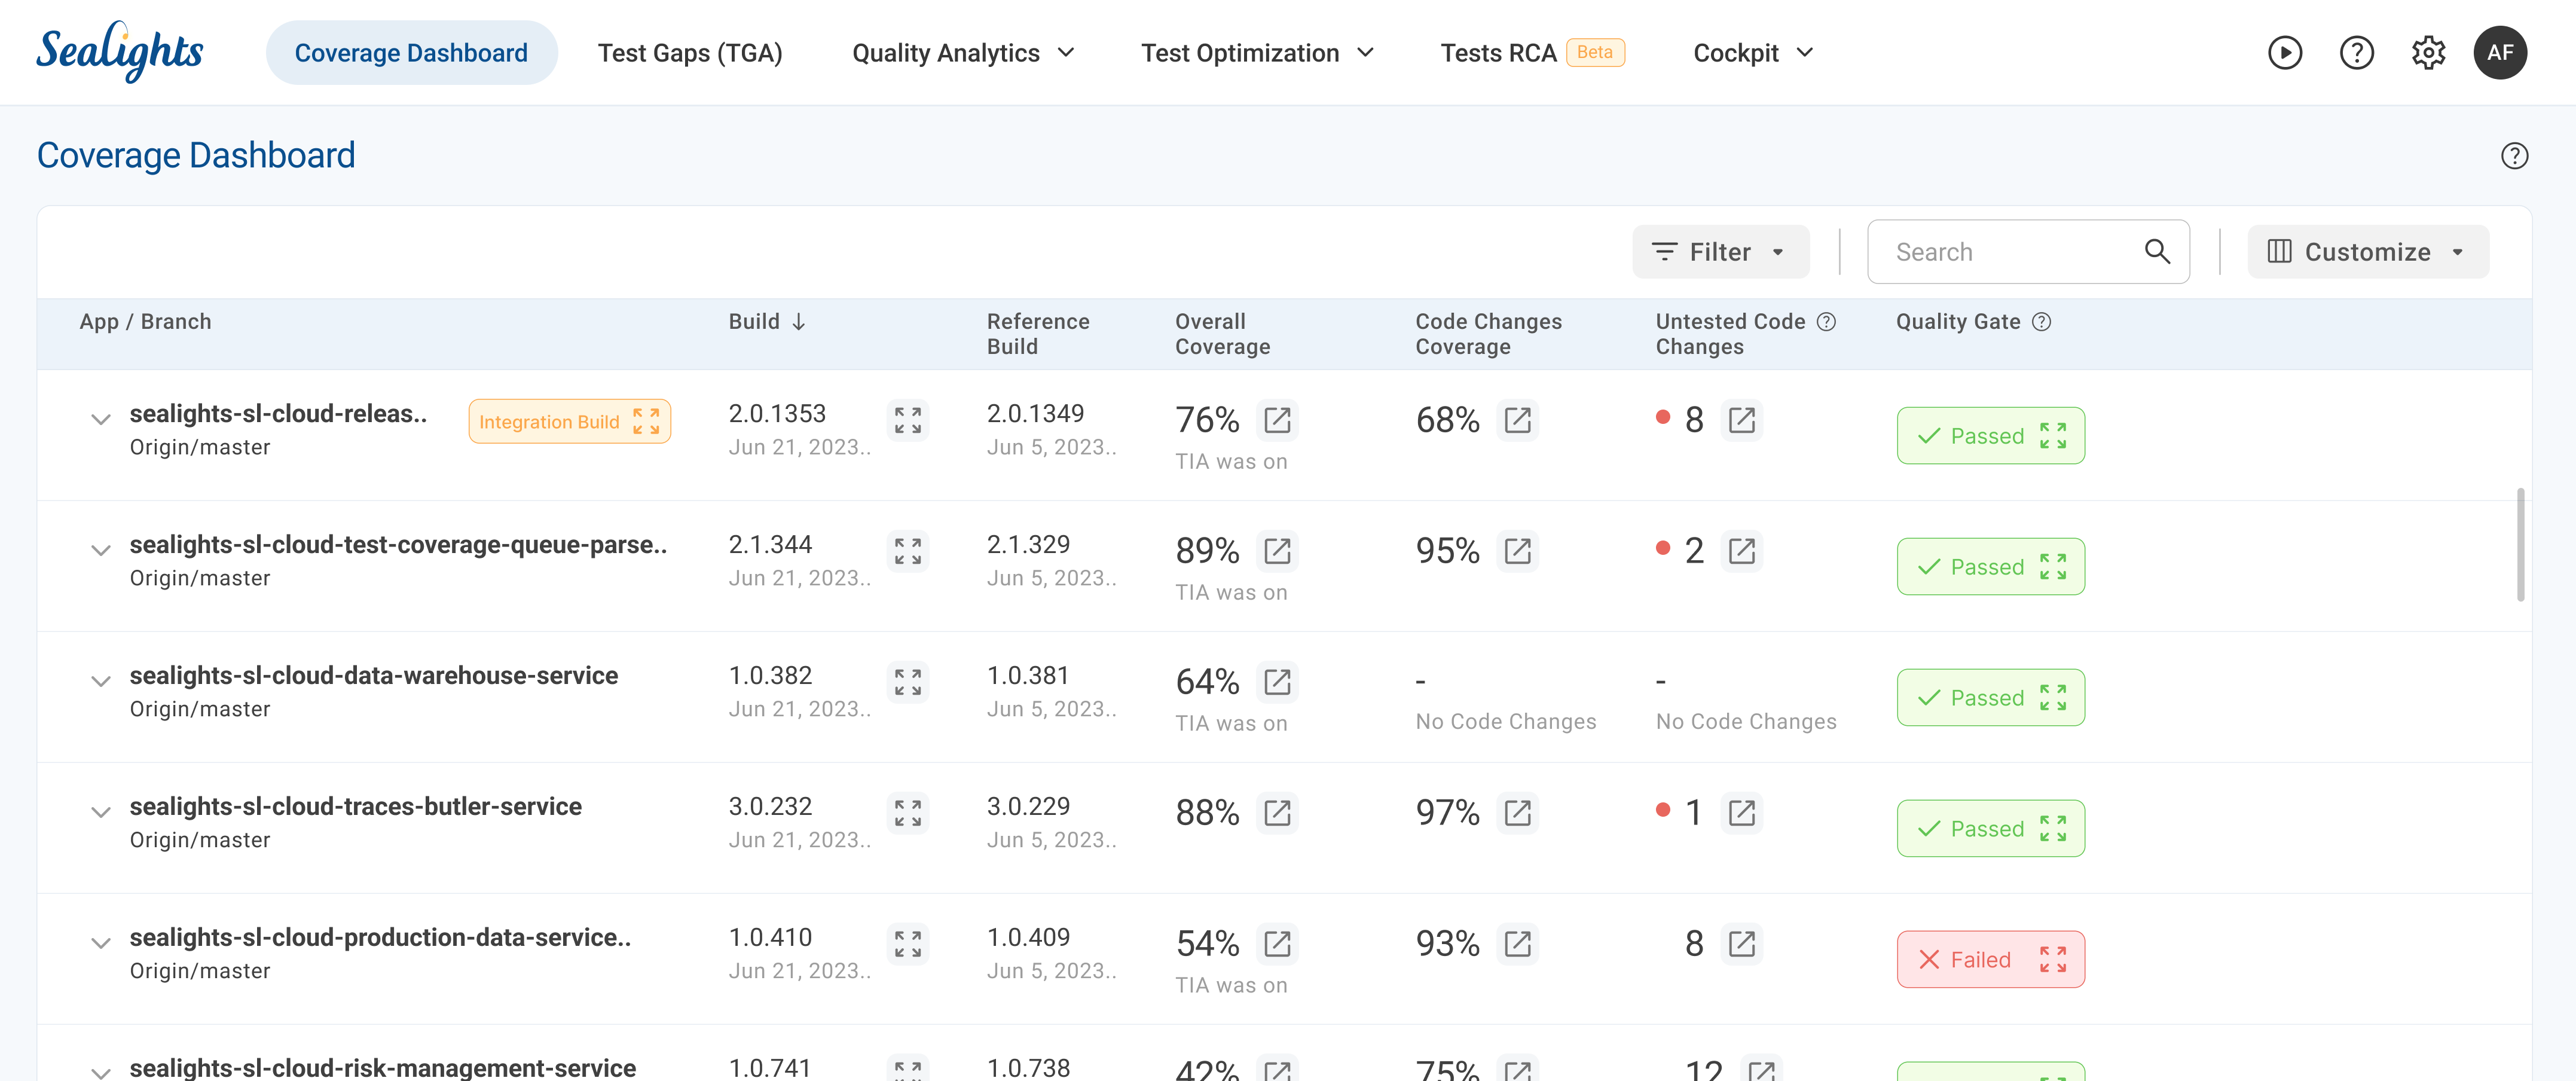
SeaLights is thrilled to introduce the all-new Coverage Dashboard, designed to improve your code coverage analysis experience. This powerful revamp offers a streamlined interface, intuitive navigation, and a wealth of valuable insights.

Improved Terminology for Clearer Understanding

We've refined some terminology for better clarity. You'll now see "Code Changes Coverage" instead of "Modified Coverage," more accurately reflecting how this metric tracks coverage for recently modified code sections. Additionally, "Untested Code Changes" replaces "Quality Risks," providing a more focused view of areas requiring attention.

New Terminology

Seamless Navigation with New Tabs

Drill down deeper into your coverage data with ease. Clicking buttons such as Coverage Report, Untested Code Changes, and the Cockpit now opens dedicated pages in a new tab. This ensures a smooth workflow without disrupting your current view.

New Buttons to Open Drill Down Views

TIA Status with Detailed Breakdown

New TIA (Test Impact Analysis) status column provides a clear overview of your test execution. Click on the status to access the build-test stage breakdown page in a new tab, offering a granular view of how your tests interact with different code sections.

TIA Status Column with A Button for Drill Down

Quality Gate Overview Simplified

Overviewing Quality Gates summary is now more intuitive with the redesigned popup interface.

Quality Gate Passed
Quality Gate Failed + Example for multiple thresholds

Centralized Coverage Settings

Access all coverage-related settings, including Quality Gates, from a single, convenient popup window. This streamlined approach eliminates the need to navigate through different menus, saving you valuable time. Easily configure Quality Gate thresholds to ensure your code meets the desired quality standards.

Quality Gate Settings

Build History Enhancements

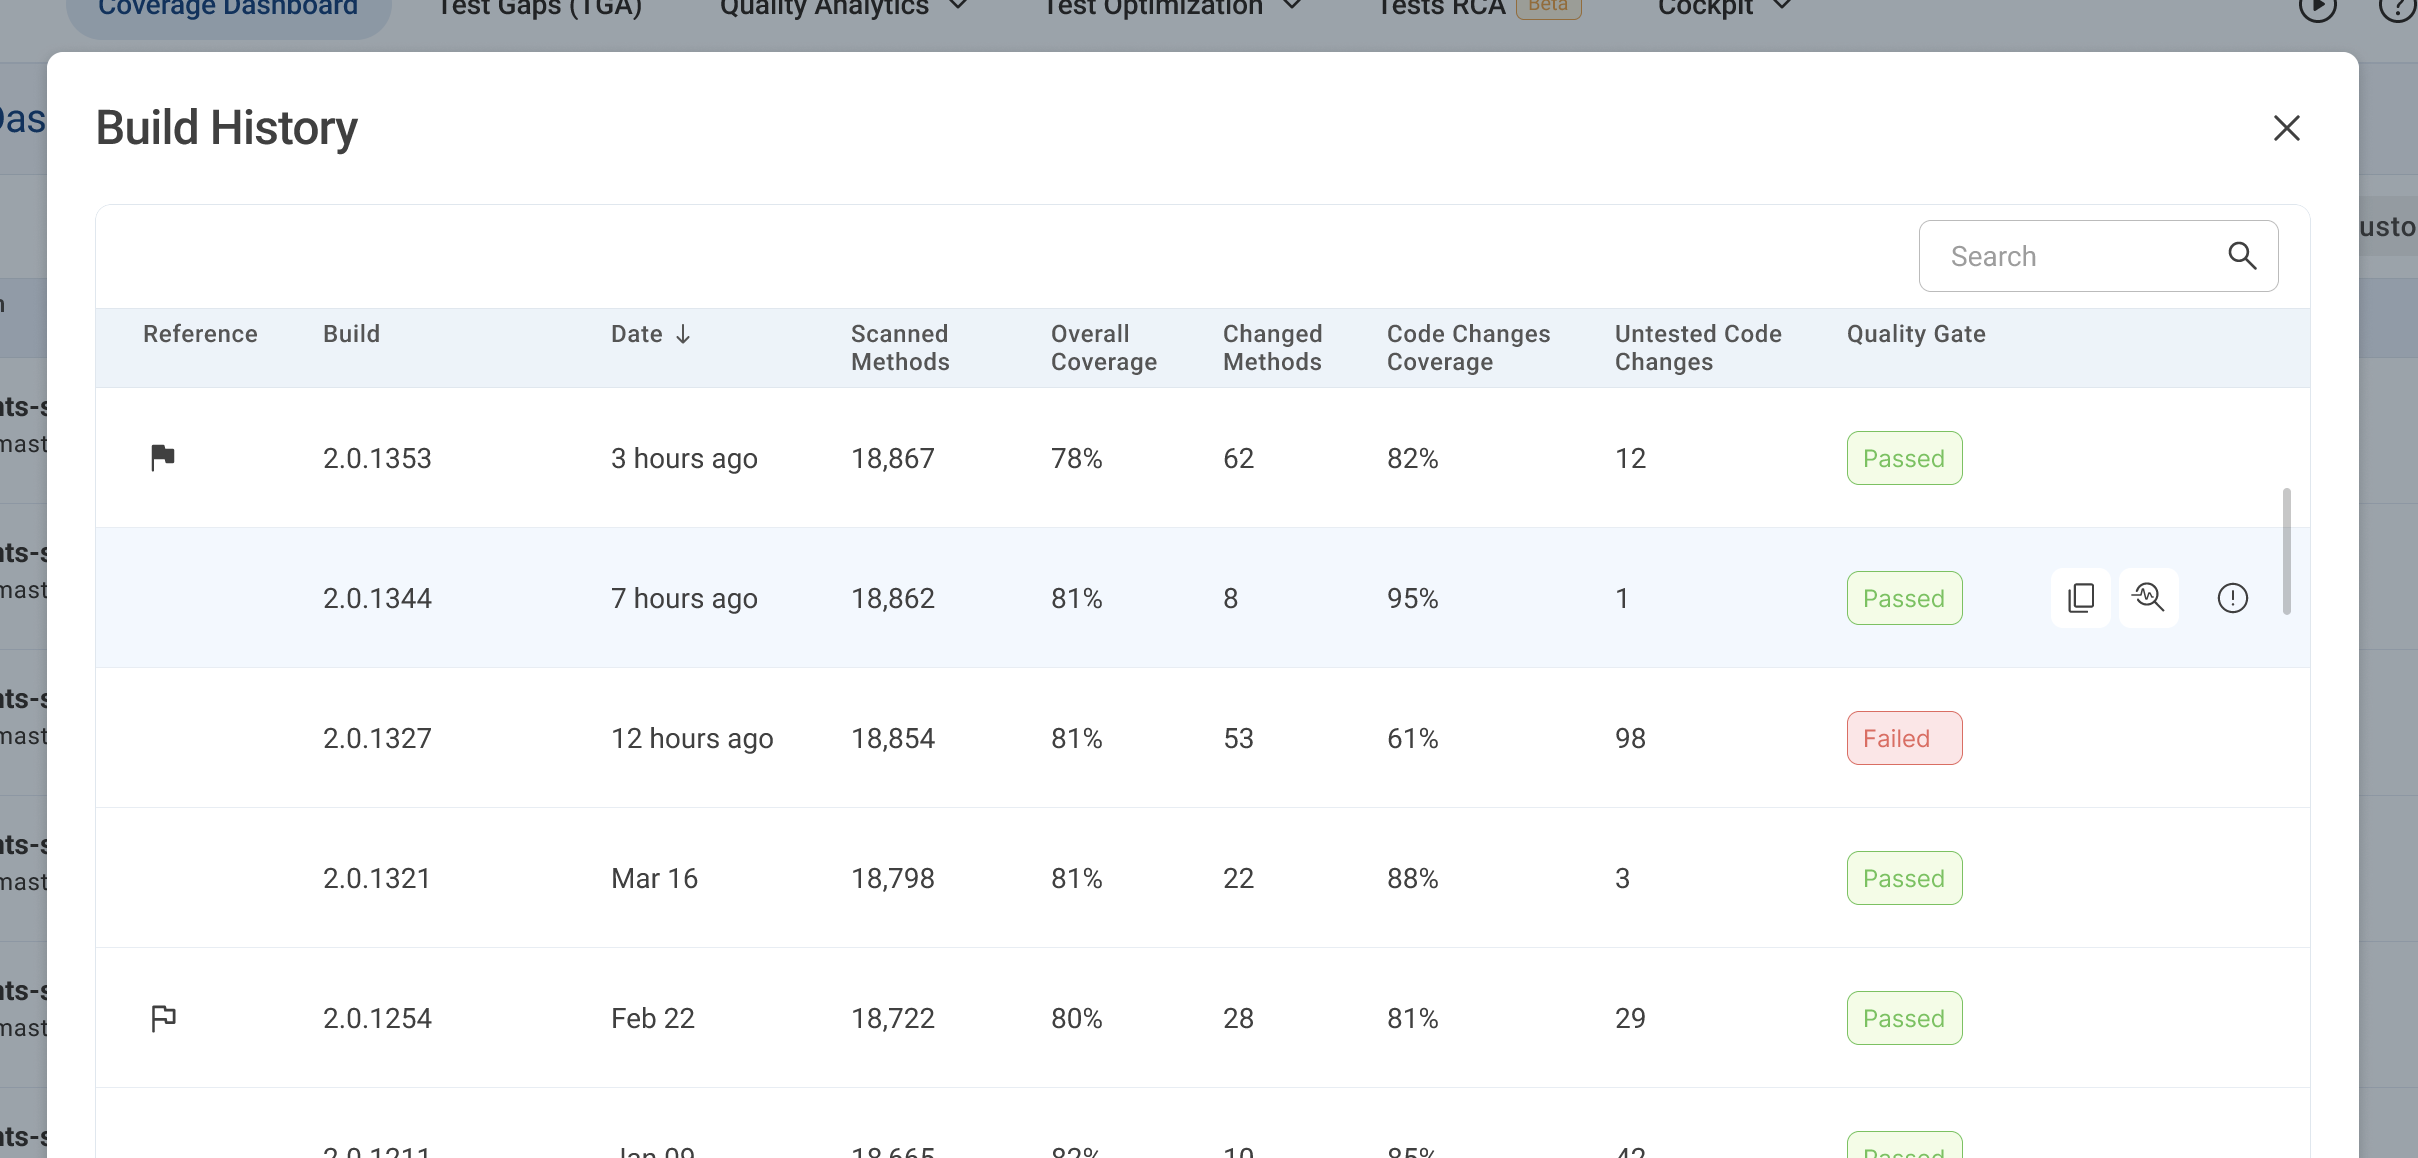
The revamped Build History popup delivers even more valuable information. Now, you can see the number of changed methods associated with each build, providing additional context for your analysis. Additionally, you can easily copy the build name for quick reference and leverage a new button to open the Cockpit view specifically for DevOps users (assuming they have permission).

New Build History List

Customize Your View with Column Management

Personalize your experience by tailoring the table columns displayed on the Coverage Dashboard. The new column management feature allows you to show or hide specific columns based on your preferences, ensuring you focus on the data most relevant to your needs.

Customize Columns

Dedicated Documentation at Your Fingertips

Unsure about a specific feature or need clarification? Simply click the Help icon located throughout the dashboard. This icon instantly opens a dedicated documentation page, providing detailed explanations and helpful resources to guide you through every aspect of the new Coverage Dashboard.

Help Button

Last updated

Was this helpful?