> For the complete documentation index, see [llms.txt](https://docs.sealights.io/knowledgebase/llms.txt). Markdown versions of documentation pages are available by appending `.md` to page URLs; this page is available as [Markdown](https://docs.sealights.io/knowledgebase/guides/user-story-coverage/user-story-coverage-report-overview/release-go-no-go-report/how-to-generate-edit-the-report.md).
# How to Generate / Edit the Report
### Requirements:
* Ensure all relevant custom fields are created in Jira before generating any report.
* Ensure deployment is complete. Refer to the [Deployment Guide](/knowledgebase/guides/user-story-coverage/technical-overview/deployment-guide.md) for script deployment instructions.
* Consider your team's reporting preferences and data analysis needs when selecting an approach for generating the reports.
***
## Generating Reports in Jira
Ready to assess your User Story coverage and ensure a smooth release? Here are two convenient approaches to generate your report in Jira:
### **Option 1: Advanced Reporting with JXL Plugin (Recommended)**
#### **Benefits:**
* **Clear Structure:** Visualize task hierarchy and relationships for easy understanding.
* **Flexible Formatting:** Customize the report layout and content to your preference.
* **User-Friendly Features:** Leverage additional plugin functionalities for efficient report creation.
#### **Steps:**
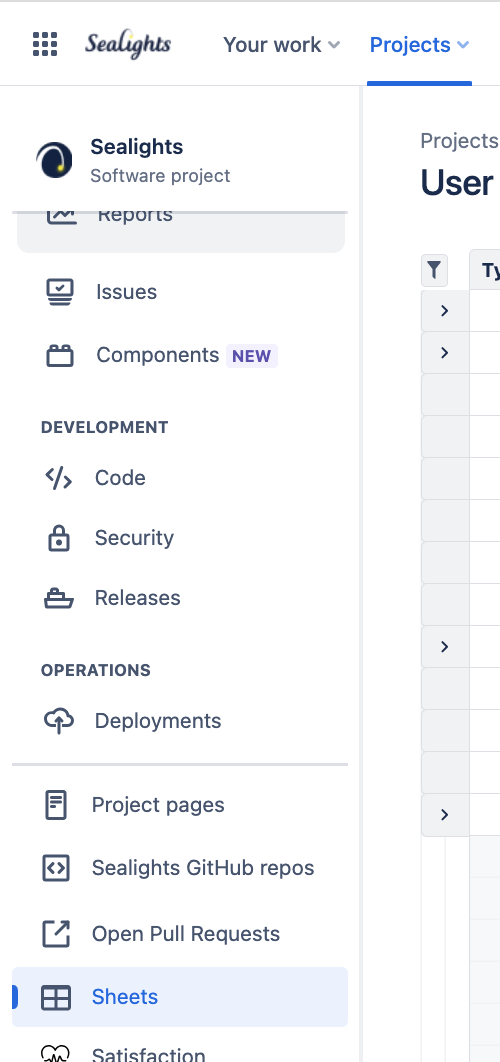
1. **Navigate:** Locate your project in Jira and open the "Sheets" section. Create a new Sheet.\ 
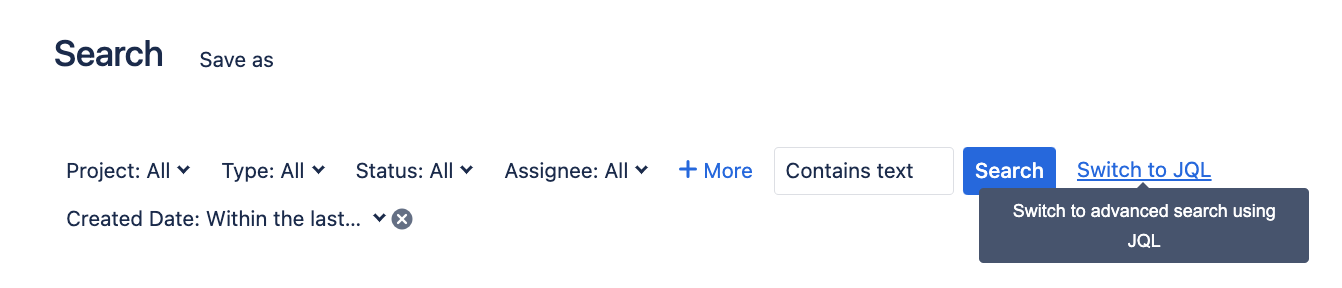
2. **Craft Your Query:** Utilize a customized JQL query to retrieve relevant data (example provided). Remember to adjust the query based on your specific needs.\
`project = "SLDEV" AND cf[10900] IS NOT EMPTY and updated > startOfDay(-30d)`\
( *cf\[10900] = customized field: Modified Coverage )*
3. **Visualize Hierarchy:** Define or edit the hierarchy to display stories and subtasks (recommended for quick scanning).\

4. **Customize and Create:** Select desired columns, adjust settings, and click "Create" to generate your report.
5. **Edit with Ease:** Modify the report anytime using the "Edit" button.
### **Option 2: Basic Reporting with Jira Filters**
**Considerations:**
* **Limited Formatting:** Offers basic table presentation without advanced formatting options.
* **No Hierarchy Visualization:** Task relationships and hierarchy might not be clearly visible.
**Steps:**
1. **Access Filters:** Locate the "Filters" page in your relevant project and create a new Filter.
2. **Build Your Query:** Employ the JQL option to construct a customized query (similar to step 2 in Option 1).
3. **Configure and Generate:** Set up desired columns, adjust other settings, and click "Create" to generate your report.
4. **Edit as Needed:** Utilize the "Edit" button for future modifications.
***
With these clear instructions and helpful tips, you're now empowered to generate User Story Coverage Reports efficiently and confidently!
---
# Agent Instructions
This documentation is published with GitBook. GitBook is the documentation platform designed so that both humans and AI agents can read, navigate, and reason over technical content effectively. Learn more at gitbook.com.
## Querying This Documentation
If you need additional information that is not directly available in this page, you can query the documentation by asking a question.
Perform an HTTP GET request on the following URL with the `ask` and `goal` query parameters:
```
GET https://docs.sealights.io/knowledgebase/guides/user-story-coverage/user-story-coverage-report-overview/release-go-no-go-report/how-to-generate-edit-the-report.md?ask=&goal=
```
`ask` is the immediate question: it should be specific, self-contained, and written in natural language.
`goal` is what the user is ultimately trying to achieve, the reason they need the answer. Sharing it helps GitBook give you a better, more relevant answer. A goal is most helpful when it describes the outcome the user wants rather than restating the question. For example, with `ask=how do I create an API token`, a goal like `automate deployments from our CI pipeline` lets GitBook tailor the answer to that use case.
The response will contain a direct answer to the question and relevant excerpts and sources from the documentation.
Use this mechanism when the answer is not explicitly present in the current page, you need clarification or additional context, or you want to retrieve related documentation sections.

2. **Craft Your Query:** Utilize a customized JQL query to retrieve relevant data (example provided). Remember to adjust the query based on your specific needs.\
`project = "SLDEV" AND cf[10900] IS NOT EMPTY and updated > startOfDay(-30d)`\
( *cf\[10900] = customized field: Modified Coverage )*
3. **Visualize Hierarchy:** Define or edit the hierarchy to display stories and subtasks (recommended for quick scanning).\

4. **Customize and Create:** Select desired columns, adjust settings, and click "Create" to generate your report.
5. **Edit with Ease:** Modify the report anytime using the "Edit" button.
### **Option 2: Basic Reporting with Jira Filters**
**Considerations:**
* **Limited Formatting:** Offers basic table presentation without advanced formatting options.
* **No Hierarchy Visualization:** Task relationships and hierarchy might not be clearly visible.
**Steps:**
1. **Access Filters:** Locate the "Filters" page in your relevant project and create a new Filter.

2. **Craft Your Query:** Utilize a customized JQL query to retrieve relevant data (example provided). Remember to adjust the query based on your specific needs.\
`project = "SLDEV" AND cf[10900] IS NOT EMPTY and updated > startOfDay(-30d)`\
( *cf\[10900] = customized field: Modified Coverage )*
3. **Visualize Hierarchy:** Define or edit the hierarchy to display stories and subtasks (recommended for quick scanning).\

4. **Customize and Create:** Select desired columns, adjust settings, and click "Create" to generate your report.
5. **Edit with Ease:** Modify the report anytime using the "Edit" button.
### **Option 2: Basic Reporting with Jira Filters**
**Considerations:**
* **Limited Formatting:** Offers basic table presentation without advanced formatting options.
* **No Hierarchy Visualization:** Task relationships and hierarchy might not be clearly visible.
**Steps:**
1. **Access Filters:** Locate the "Filters" page in your relevant project and create a new Filter.